
Economics of a Pyrolysis Plant: Returns, Savings and Levers

31.10.2026
Economics of a Pyrolysis Plant: Returns, Savings and Levers
A pyrolysis plant earns in several places at once: it produces electricity and heat for your own operations, plus biochar and CO₂ removal certificates as additional revenue. Typical payback periods are between 3 and 8 years, depending on the site. This article shows which items belong in the calculation, which quantities are behind them and which levers improve the result.

Lucie Töpfer
Managing Director, pyropower GmbH

Key facts
- Typical payback periods are between 3 and 8 years, depending on the site.
- Four revenue sources carry the calculation: avoided grid purchases or feed-in, used heat, biochar and CO₂ removal certificates.
- Many operating hours and good heat use are the central levers for the result.
- Your own residues improve the calculation twice: no fuel purchases and often no disposal costs.
The calculation in two columns
An economic assessment compares, year by year, what the plant earns or saves and what it costs.
| Returns and savings | Costs |
|---|---|
| Avoided grid purchases or revenue from feed-in | Fuel, if purchased |
| Replaced heat from natural gas, heating oil or electricity | Maintenance, service and wear |
| Sale or own use of the biochar | Staff for inspection, fuel acceptance and filling |
| CO₂ removal certificates | Power for own consumption, insurance, measurements |
| Avoided disposal costs for your own residues | Interest and repayment |
The difference gives the usual key figures:
- Payback period: after how many years the investment has been earned back. 3 to 8 years are typical.
- Net present value: what the plant earns over its entire service life, discounted to today.
- Internal rate of return: the return on the investment, comparable with other uses of capital.
The cost side in detail is described in the article Pyrolysis plant costs.
The quantities behind the calculation
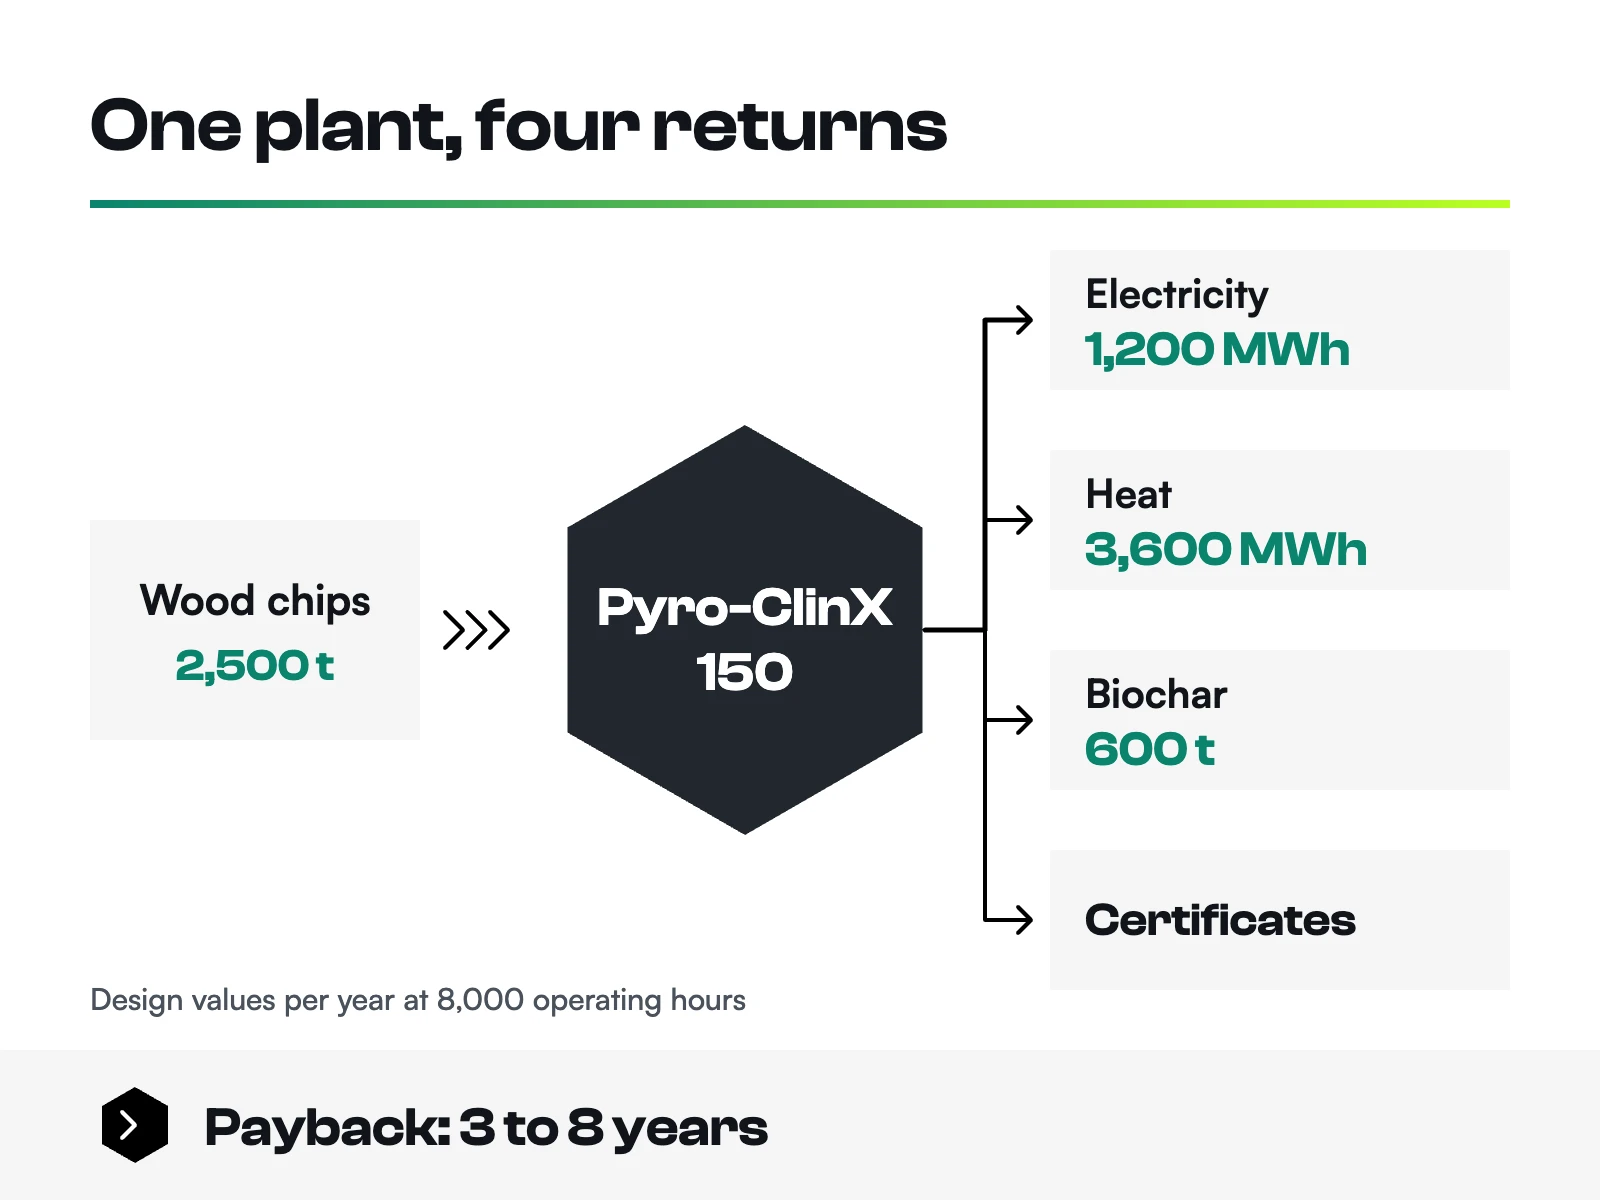
Using a Pyro-ClinX with 150 kW electrical (gross) and max. 450 kW thermal as an example, the table shows which quantities go into the calculation. The values refer to the design with 8,000 operating hours per year. The right-hand column shows how strongly a price affects the annual result.
| Quantity | Amount per year | Effect of a price difference |
|---|---|---|
| Electricity (gross) | around 1,200 MWh | 1 ct/kWh equals up to €12,000 per year |
| Heat | up to 3,600 MWh | 1 ct/kWh equals up to €36,000 per year |
| Biochar (dry matter) | around 600 t | €10/t equals around €6,000 per year |
| Wood chips (10 % moisture content) | around 2,500 t | €10/t equals around €25,000 per year |
Design values of the Pyro-ClinX at 8,000 operating hours. Electricity gross, before own consumption.
Each business enters its own prices. The table shows where a close look pays off:
- One cent on the heat price weighs up to three times as much as one cent on the electricity price, because the plant supplies up to three times as much heat as electricity.
- Businesses that buy expensive electricity or gas today benefit correspondingly more from every kilowatt hour generated on site.
- Low-cost or own residues improve the result directly via the fuel line.
Operating hours: the lever behind every line
All returns in the table grow with operating hours, while fixed costs stay the same. Every additional hour delivers electricity, heat and biochar at once. That is why the Pyro-ClinX is designed for 8,000 operating hours per year. This works well with:
- a steady fuel supply all year round, for example from your own residues or fixed supply contracts,
- a heat consumer that also needs heat in summer, for example for production, drying or cooling via an absorption chiller,
- remote monitoring and planned maintenance windows.
How the technology has proven itself in long-term operation is shown by our test and demonstration plant in Cottbus, with around 30,000 operating hours.
Valuing heat and power correctly
Heat is worth as much as the energy it replaces. If it replaces natural gas, the business saves the gas quantity, meaning the heat divided by the efficiency of the previous boiler, including CO₂ price and grid charges. A heat load profile over the year shows how much of the heat is used, and therefore how much return this line holds.
The same logic applies to electricity. Self-consumed electricity replaces grid purchases including energy price, grid charges, levies and taxes, and is therefore often worth more than electricity fed into the grid. Electricity fed into the grid is remunerated under the EEG, the KWKG or through direct marketing. Which programmes come into question for this and for the investment is described in the funding overview.
Heat is often the key to a good calculation. Using it all year round gets the full value out of every operating hour.
Lucie TöpferManaging Director, pyropower GmbH
Biochar and CO₂ removal certificates
Biochar is the return that a wood chip CHP unit does not have. The difference between the technologies is explained in the article Wood chip CHP, gasifier or pyrolysis plant. There are several routes for the biochar:
- use it in your own operations, for example in agriculture, composting or livestock farming,
- sell it if it is produced in line with the EBC standard and its whereabouts are documented,
- hand it over to pyropower for the Pyro-ClinX, together with the certificates on request.
If the carbon remains bound in its application and its whereabouts are documented, CO₂ removal certificates can be issued. They are a separate source of revenue. More on our biochar page.
Five tips for a reliable calculation
- Use your own load profiles: electricity and heat demand over the year, not just annual totals.
- Set fuel realistically: quantity, moisture content and price over the service life, with a reserve for varying quality.
- Compare three scenarios: a base case, a cautious case and a favourable case.
- Show funding separately, so it remains clear how the project performs with and without grants.
- Use the funding check: in the pyropower pre-project phase, we check at no extra cost which programmes fit.
Conclusion
A pyrolysis plant pays off particularly well if it runs many hours a year, uses or sells its heat and has a reliable fuel supply. Typical payback periods are then between 3 and 8 years. Electricity, heat, biochar and certificates spread the result across several pillars.
We are happy to check the economics for your site in advance, free of charge. Simply get in touch or use the form below. If you want to go into more depth, we recommend the pre-project phase: it calculates the project with your company figures, including a funding check at no extra cost.
Frequently asked questions
How long is the payback period of a pyrolysis plant?
Typically 3 to 8 years, depending on the site. Heat use, energy prices, fuel and funding are decisive. We are happy to provide an initial assessment for your site free of charge.
How many operating hours make sense?
The more, the better, because every hour delivers electricity, heat and biochar at the same time. The Pyro-ClinX is designed for 8,000 hours per year.
What is the heat from a pyrolysis plant worth?
As much as the energy it replaces, valued at price, CO₂ price and efficiency of the previous generator. That is why it pays to plan consumers for the whole year.
Do I have to market the biochar myself?
No. You can use it yourself, sell it or hand it over to pyropower for the Pyro-ClinX. The same applies to the CO₂ removal certificates.
Does a pyrolysis plant pay off without your own residues?
Yes, if heat and electricity are used on site. The Pyro-ClinX runs on purchased wood chips G30 to G45. Your own residues improve the calculation further, because purchasing and often disposal costs no longer apply.
Download
Brochure and data sheet Pyro-ClinX
Technical data, feedstocks, products and project steps at a glance (PDF).
Download brochure (PDF)

 info@pyro-power.com
 +49 355 866 870 82
 pyropower GmbH